Comparing Metro Atlanta housing data from July 2021 to July 2020, sales prices were up, days on the market were down, and sales volume was down for the first time since April.
This is a very important data set, as this is the first time we can compare month-to-month numbers that weren’t affected by the lockdown.
The number of new listings in North Fulton was about the same as July 2020, with the average list price up to $668,894 from $623,628. The average number of days on the market was down 68%, from 41 to 13, while the average sales price climbed to $648,056 from $535,131.

In East Cobb, the average list price in July 2021 was $492,271, a 3% increase over 2020. The overall number of sales comparing month to month was down 3 percent, from 438 to 423, but the average sales price was $506,272, up from $431,348.

In a rare reversal, the average sales price for an Intown home fell slightly comparing month to month, from $573,983 in 2020 to $529,394 in 2021. The average list price was up 7%, to $650,812 from $606,255. The number of sales went from 219 in July 2020 to 247 last month. The number of days on the market was 28, down from 36 July a year ago.
While Sandy Springs had a significant uptick in the average list price, from $596,395 to $695,343, the average sales price from July 2021 was $589,723, a 4% increase over 2020, $566,740. The average number of days on the market fell 61%, from 44 days to 17. For both July 2020 and ’21, there were 200 new listings.
The number of new listings in Brookhaven/Dunwoody fell 13%, from 336 to 291. Last month, the average list price was $597,451, a 15% increase from 2021 of $519,403. The average sales price increased 19% to $607,424 in July 2021, from $508,709 in 2020.
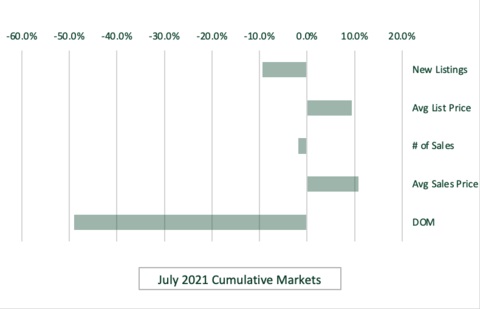
As we continue to analyze this hyper-local data — the only real estate company in Atlanta providing these numbers every month — we expect to see a narrowing in the number of new listings and the number of sales. Still, prices should continue to climb, and houses will be on the market for shorter periods as demand continues to outpace the inventory.
To view Dorsey Alston’s newest listings each week visit http://dorseyalston.idxbroker.com/i/active-listings.

