Inventory across Atlanta has yet to catch up with demand, but compared with April 2020 — when metro Atlanta was in a complete lockdown — Buckhead and Brookhaven/Dunwoody experienced jumps of more than 60% in the number of new listings last month.
In fact, the six sub-areas Dorsey Alston monitors all experienced significant upticks in the number of listings, and just about all saw a significant percentage increase in the price paid for homes over this time last year.
Not surprisingly, given the dearth of inventory, the number of days on the market fell precipitously. That number was in the teens in East Cobb and North Fulton.
What we see comparing April 2021 to April 2020 is buyers purchased more houses at higher prices that spent significantly fewer days on the market.
The price people paid for homes in Buckhead increased 14%, while the average list price was up slightly, just 2.5%. The number of listings rose nearly 70%, from 287 in April 2020 to 487 in April 2021. Similarly, the number of closed sales increased nearly 78%, while the average days on the market was 44, compared to 52 this time last year.
The number of homes sold in Sandy Springs shot up 71%, from 91 a year ago to 156 last month. List prices for the area were up 12%, and the average closed sales price was $598,694, compared to $558,962 a year ago. New listings climbed nearly 40%, and the average number of days on the market dropped to 30 from 51 a year ago.
In East Cobb, the number of days on the market was a minuscule 18, down from 30 this time last year. The average sales price was up 22%, while the number of sales climbed to 382 from 251 a year ago. The average list price was up 20 percent, while the number of new listings was 480 for April 2021, compared with 347 a year ago.
New Listings in North Fulton for the month of April were up nearly 50%. The average list price was up 16%, and the sales volume climbed from 239 to 339. The average price paid was $557,006, a 17% increase. The average number of days on the market was 17, compared to 40 this time last year.
Intown is the only area that experienced slight declines in list prices and sales prices, but the number of closed sales exploded by 80%, while new listings increased 23%. Bucking the metro trend, the average number of days on the market was up to 50, from 43 a year ago.
Brookhaven/Dunwoody experienced the most significant percentage rise in the number of new listings compared to April 2020, a 61% jump, which led to a 53% increase in the number of sales and an anemic average days on the market of 25, compared with 47 a year ago. House prices increased 12%, while the average list price of $618,406 was up from $573,526 a year ago.
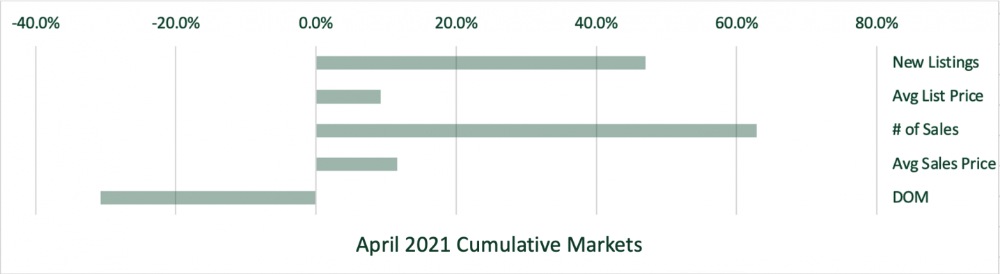
This graph show the cumulative change of the markets mentioned above compared to April 2020.
The Dorsey Alston Blog will break down the housing numbers for the previous month by submarket the second week of each month. Check back for updated numbers on what is happening in your neighborhood!

